Part 1 of this series worked through the TNERC tariff order line by line against a real 700 kVA HT-I bill from a textile mill in Erode — the 25% ToD peak surcharge, the 5% Electricity Tax, and a Group Captive open-access structure that zeroed out both Cross-Subsidy Surcharge and Additional Surcharge on that same bill. It closed on one open question: how much storage does it actually take to turn that ToD spread into captured value, and what the return on doing it looks like. This article answers that question against the same facility, the same real numbers — no illustrative buyer profile, no rounded-off placeholder figures.
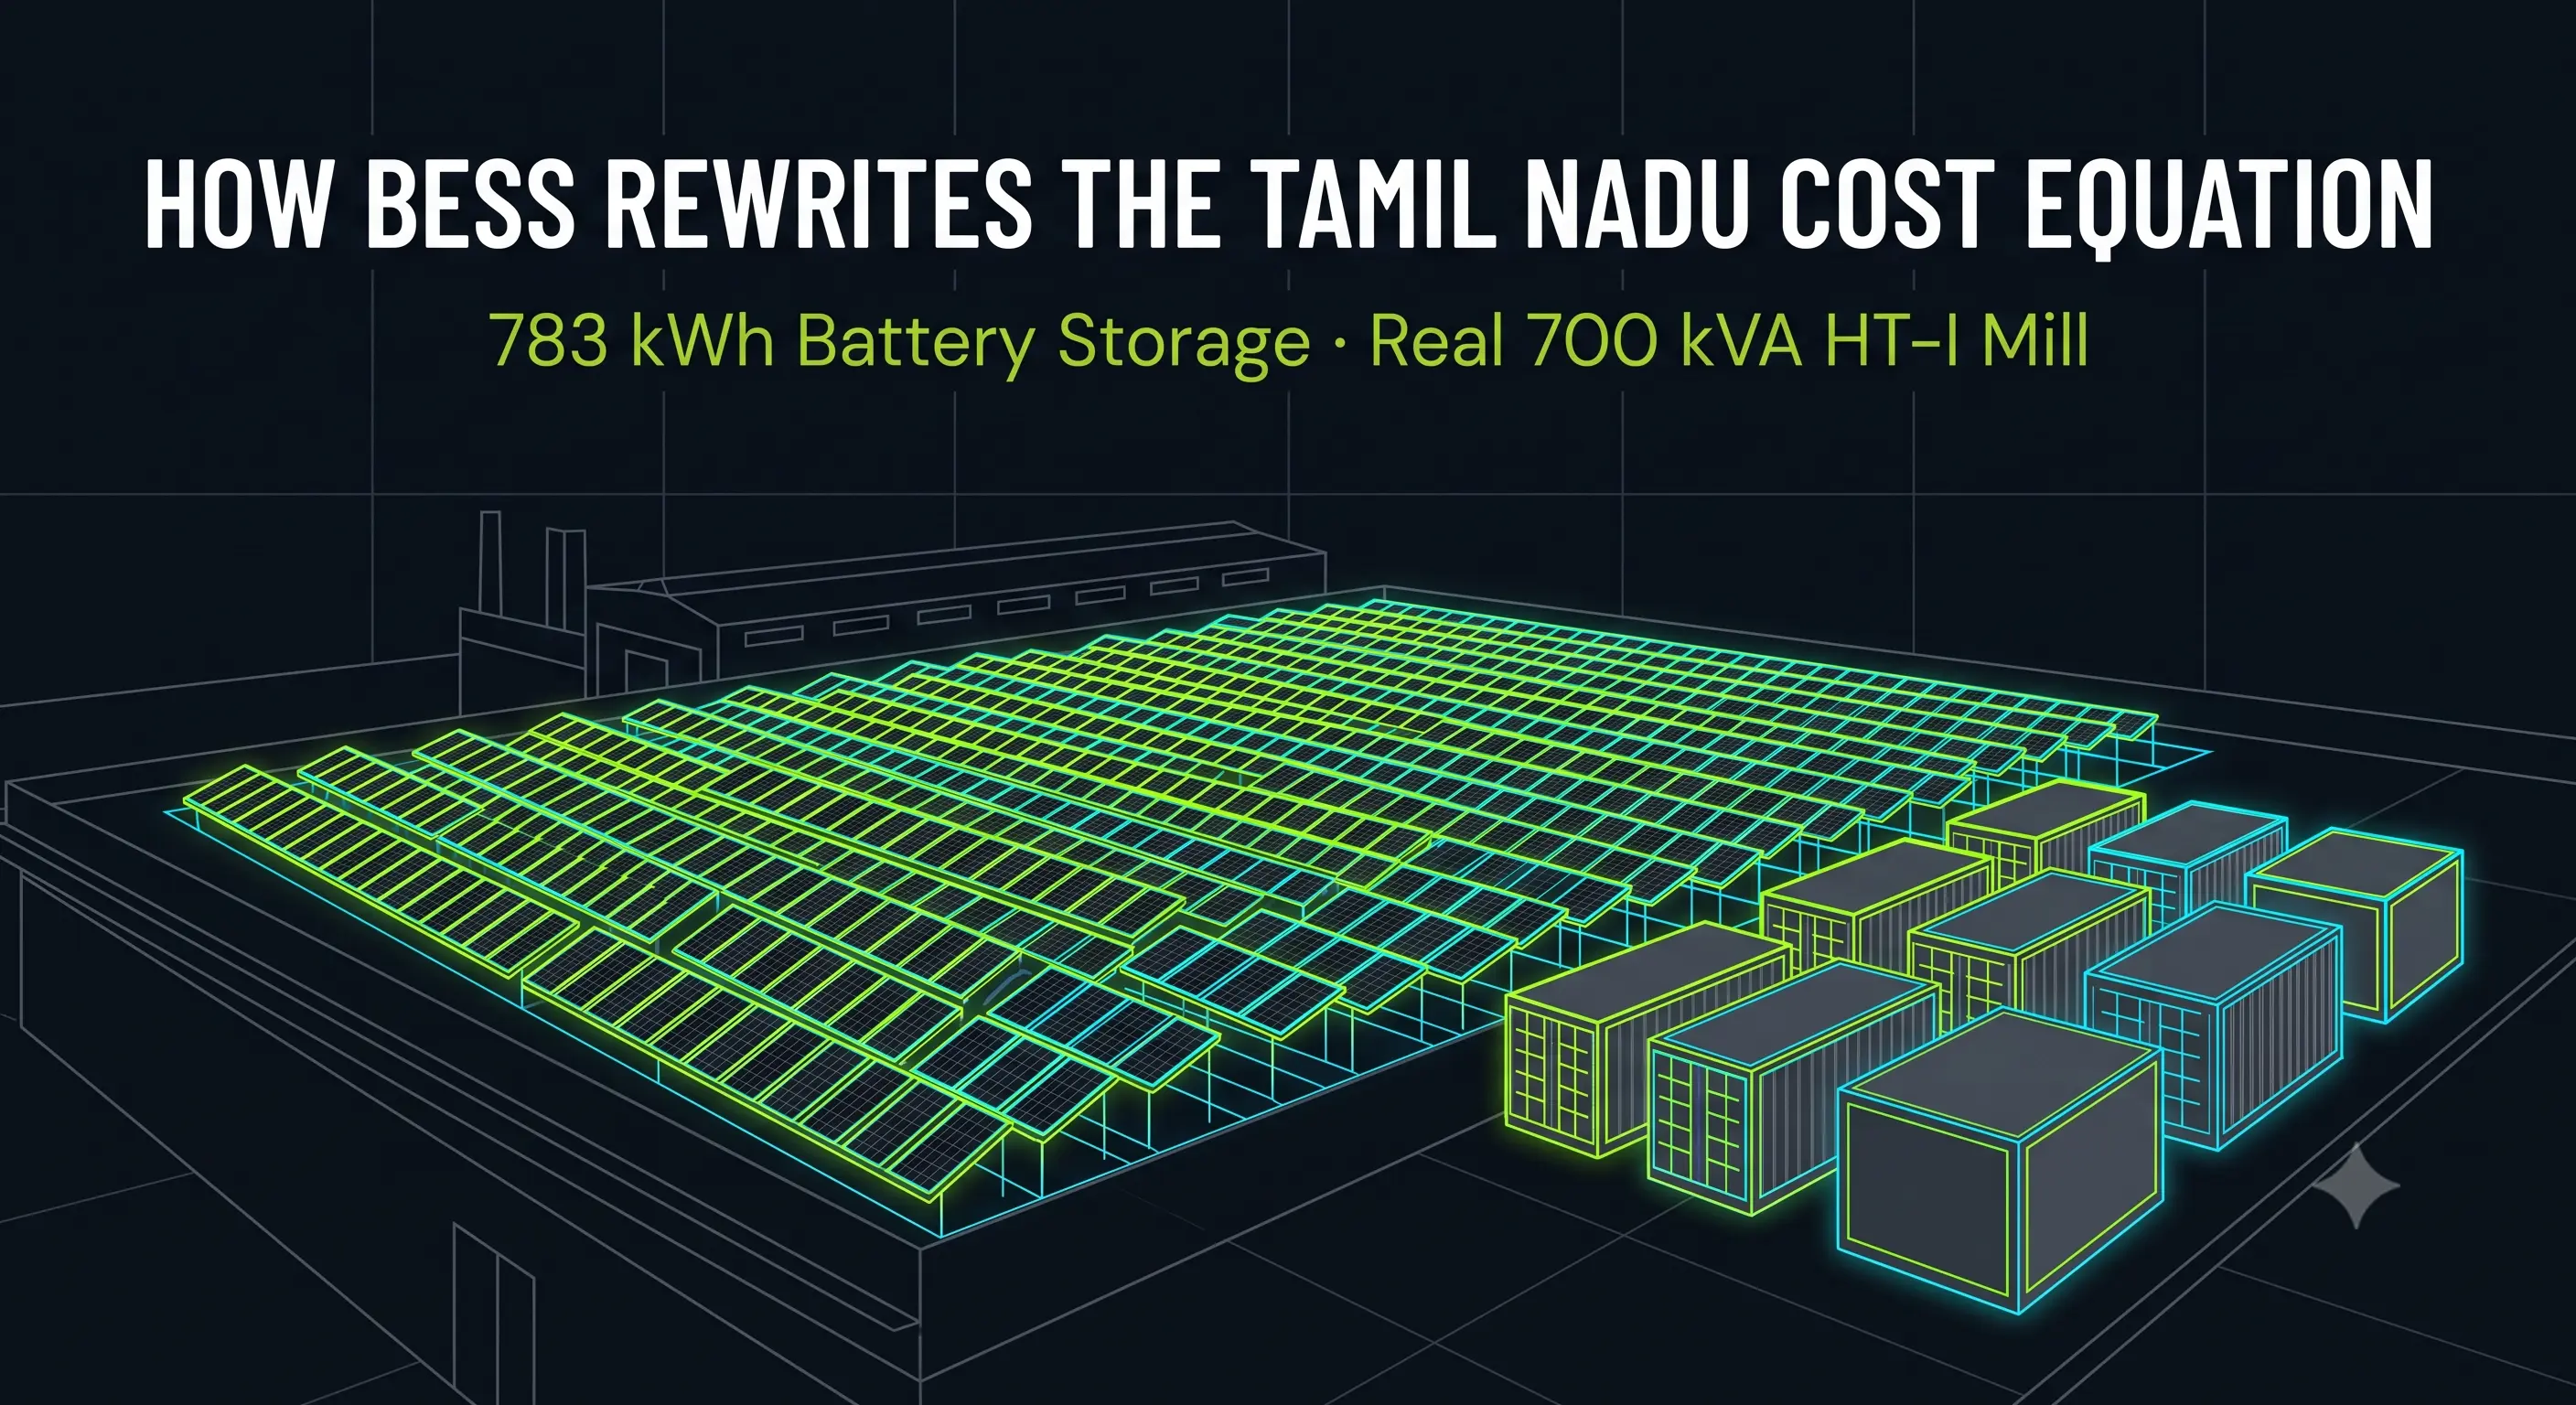
The Problem: Solar That Peaks at Noon, a Grid That Peaks at 6pm
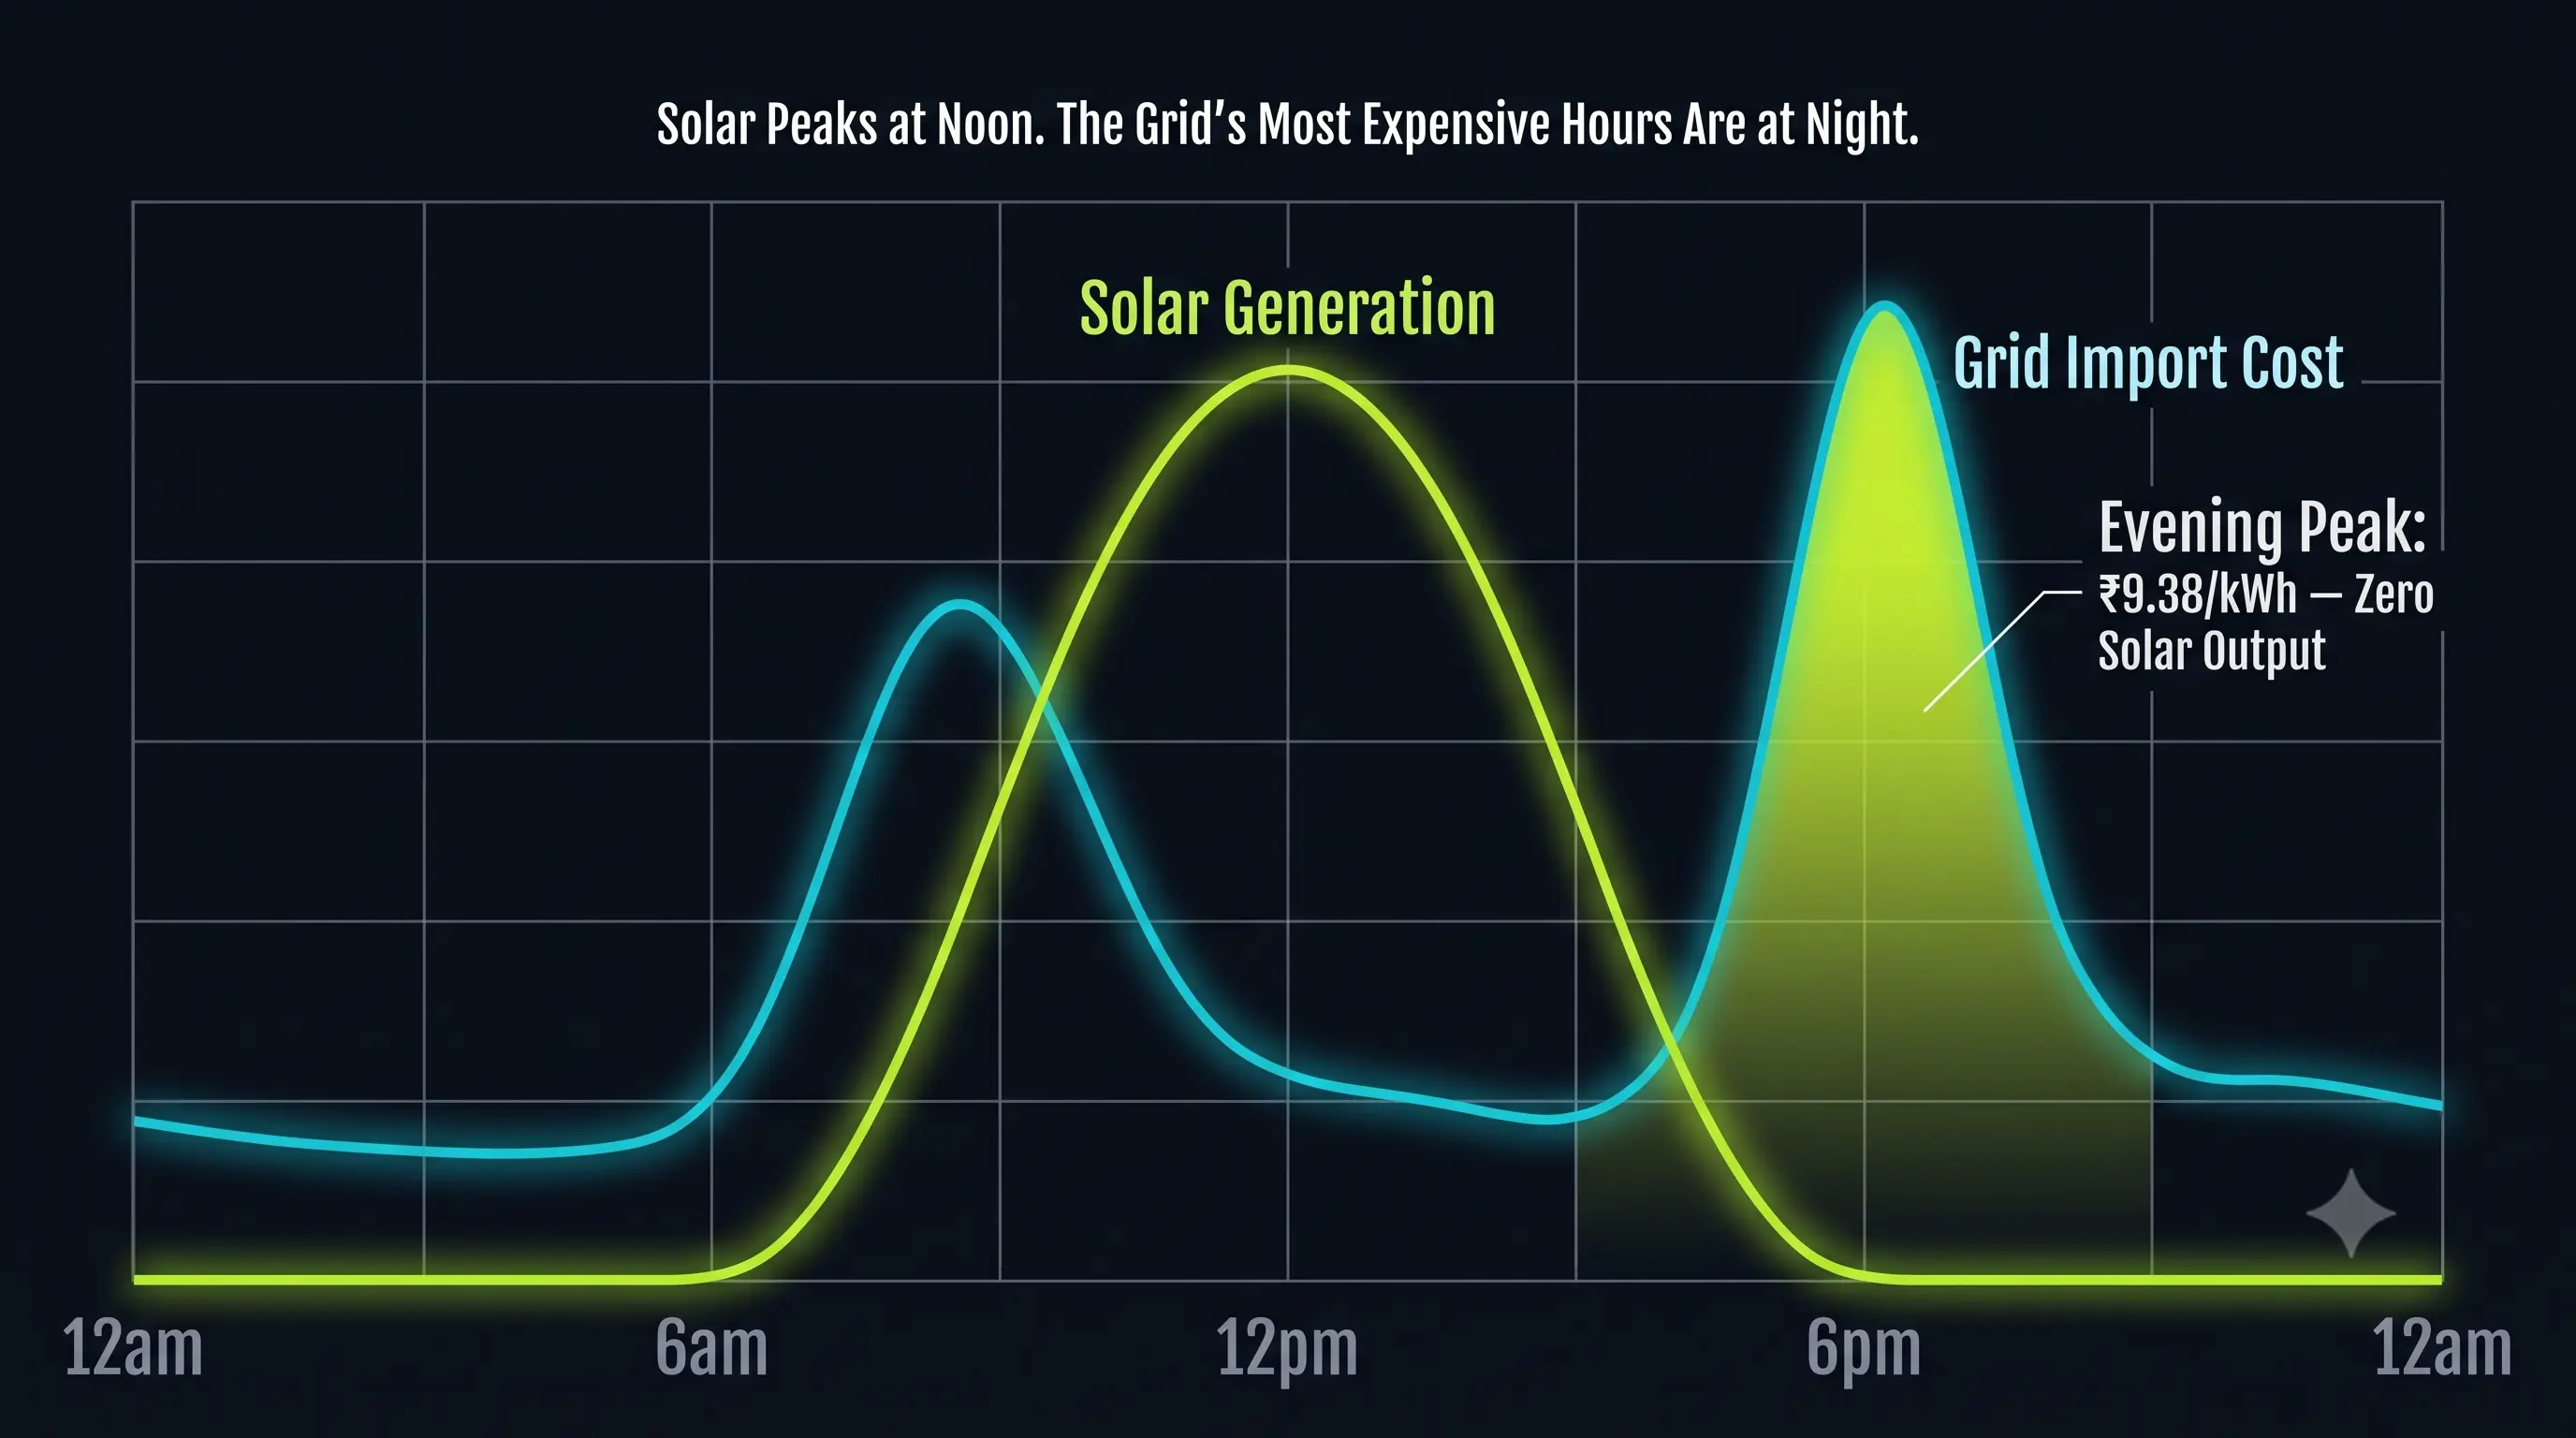
Rooftop generation and evening demand don't overlap — and Tamil Nadu's banking rules don't bridge the gap
This facility's rooftop solar generates through the middle of the day — peak output between 10am and 3pm — when the mill's own in-process load absorbs only part of it. Whatever exceeds on-site demand is exported to TNPDCL under the GISS Net Feed-In mechanism. Simultaneously, the mill draws its heaviest grid import during the 6–10pm evening peak — exactly when solar generation has already dropped to zero, and exactly the window Part 1 identified as this facility's most expensive electricity: the 25% ToD surcharge plus the 5% ad valorem tax riding on top of it.
A Battery Energy Storage System closes that mismatch mechanically: capture the daytime surplus, hold it, and discharge it into the evening peak instead of letting it export at a fraction of what that same energy is worth avoided at 6pm.
Twelve Months of Observed Surplus (Apr 2025 – Mar 2026)
The surplus profile below is the facility's own metered data, not a modelled estimate — the basis for every sizing decision that follows.
| Month | Total Surplus (kWh) | Daily Surplus (kWh/day) | BESS-Shiftable (kWh/month) | Notes |
|---|---|---|---|---|
| Apr-25 | 15,568 | 518.9 | 15,568 | Full capture |
| May-25 | 14,912 | 481.0 | 14,912 | Full capture |
| Jun-25 | 16,968 | 565.6 | 16,968 | Full capture |
| Jul-25 | 11,392 | 367.5 | 11,392 | Full capture |
| Aug-25 | 11,192 | 361.0 | 11,192 | Full capture |
| Sep-25 | 12,288 | 409.6 | 12,288 | Full capture |
| Oct-25 | 15,208 | 490.6 | 15,208 | Full capture |
| Nov-25* | 16,382 | 546.1* | 16,382 | Full capture; estimated |
| Dec-25 | 18,648 | 601.5 | 18,648 | Full capture |
| Jan-26 | 17,840 | 575.5 | 17,840 | Full capture |
| Feb-26 | 22,720 | 811.4 | 19,883 | Capped at 632 kWh/day |
| Mar-26 | 22,472 | 724.9 | 19,592 | Capped at 632 kWh/day |
| Annual Total | 1,95,590 kWh | — | 1,92,873 kWh | 98.6% capture rate |
ℹ Source: Facility's own metered generation and export data, Apr 2025 – Mar 2026, supplied by the client.
Sizing the Battery: From Daily Surplus to Installed kWh
Working backward from the dispatch target through DoD and round-trip efficiency
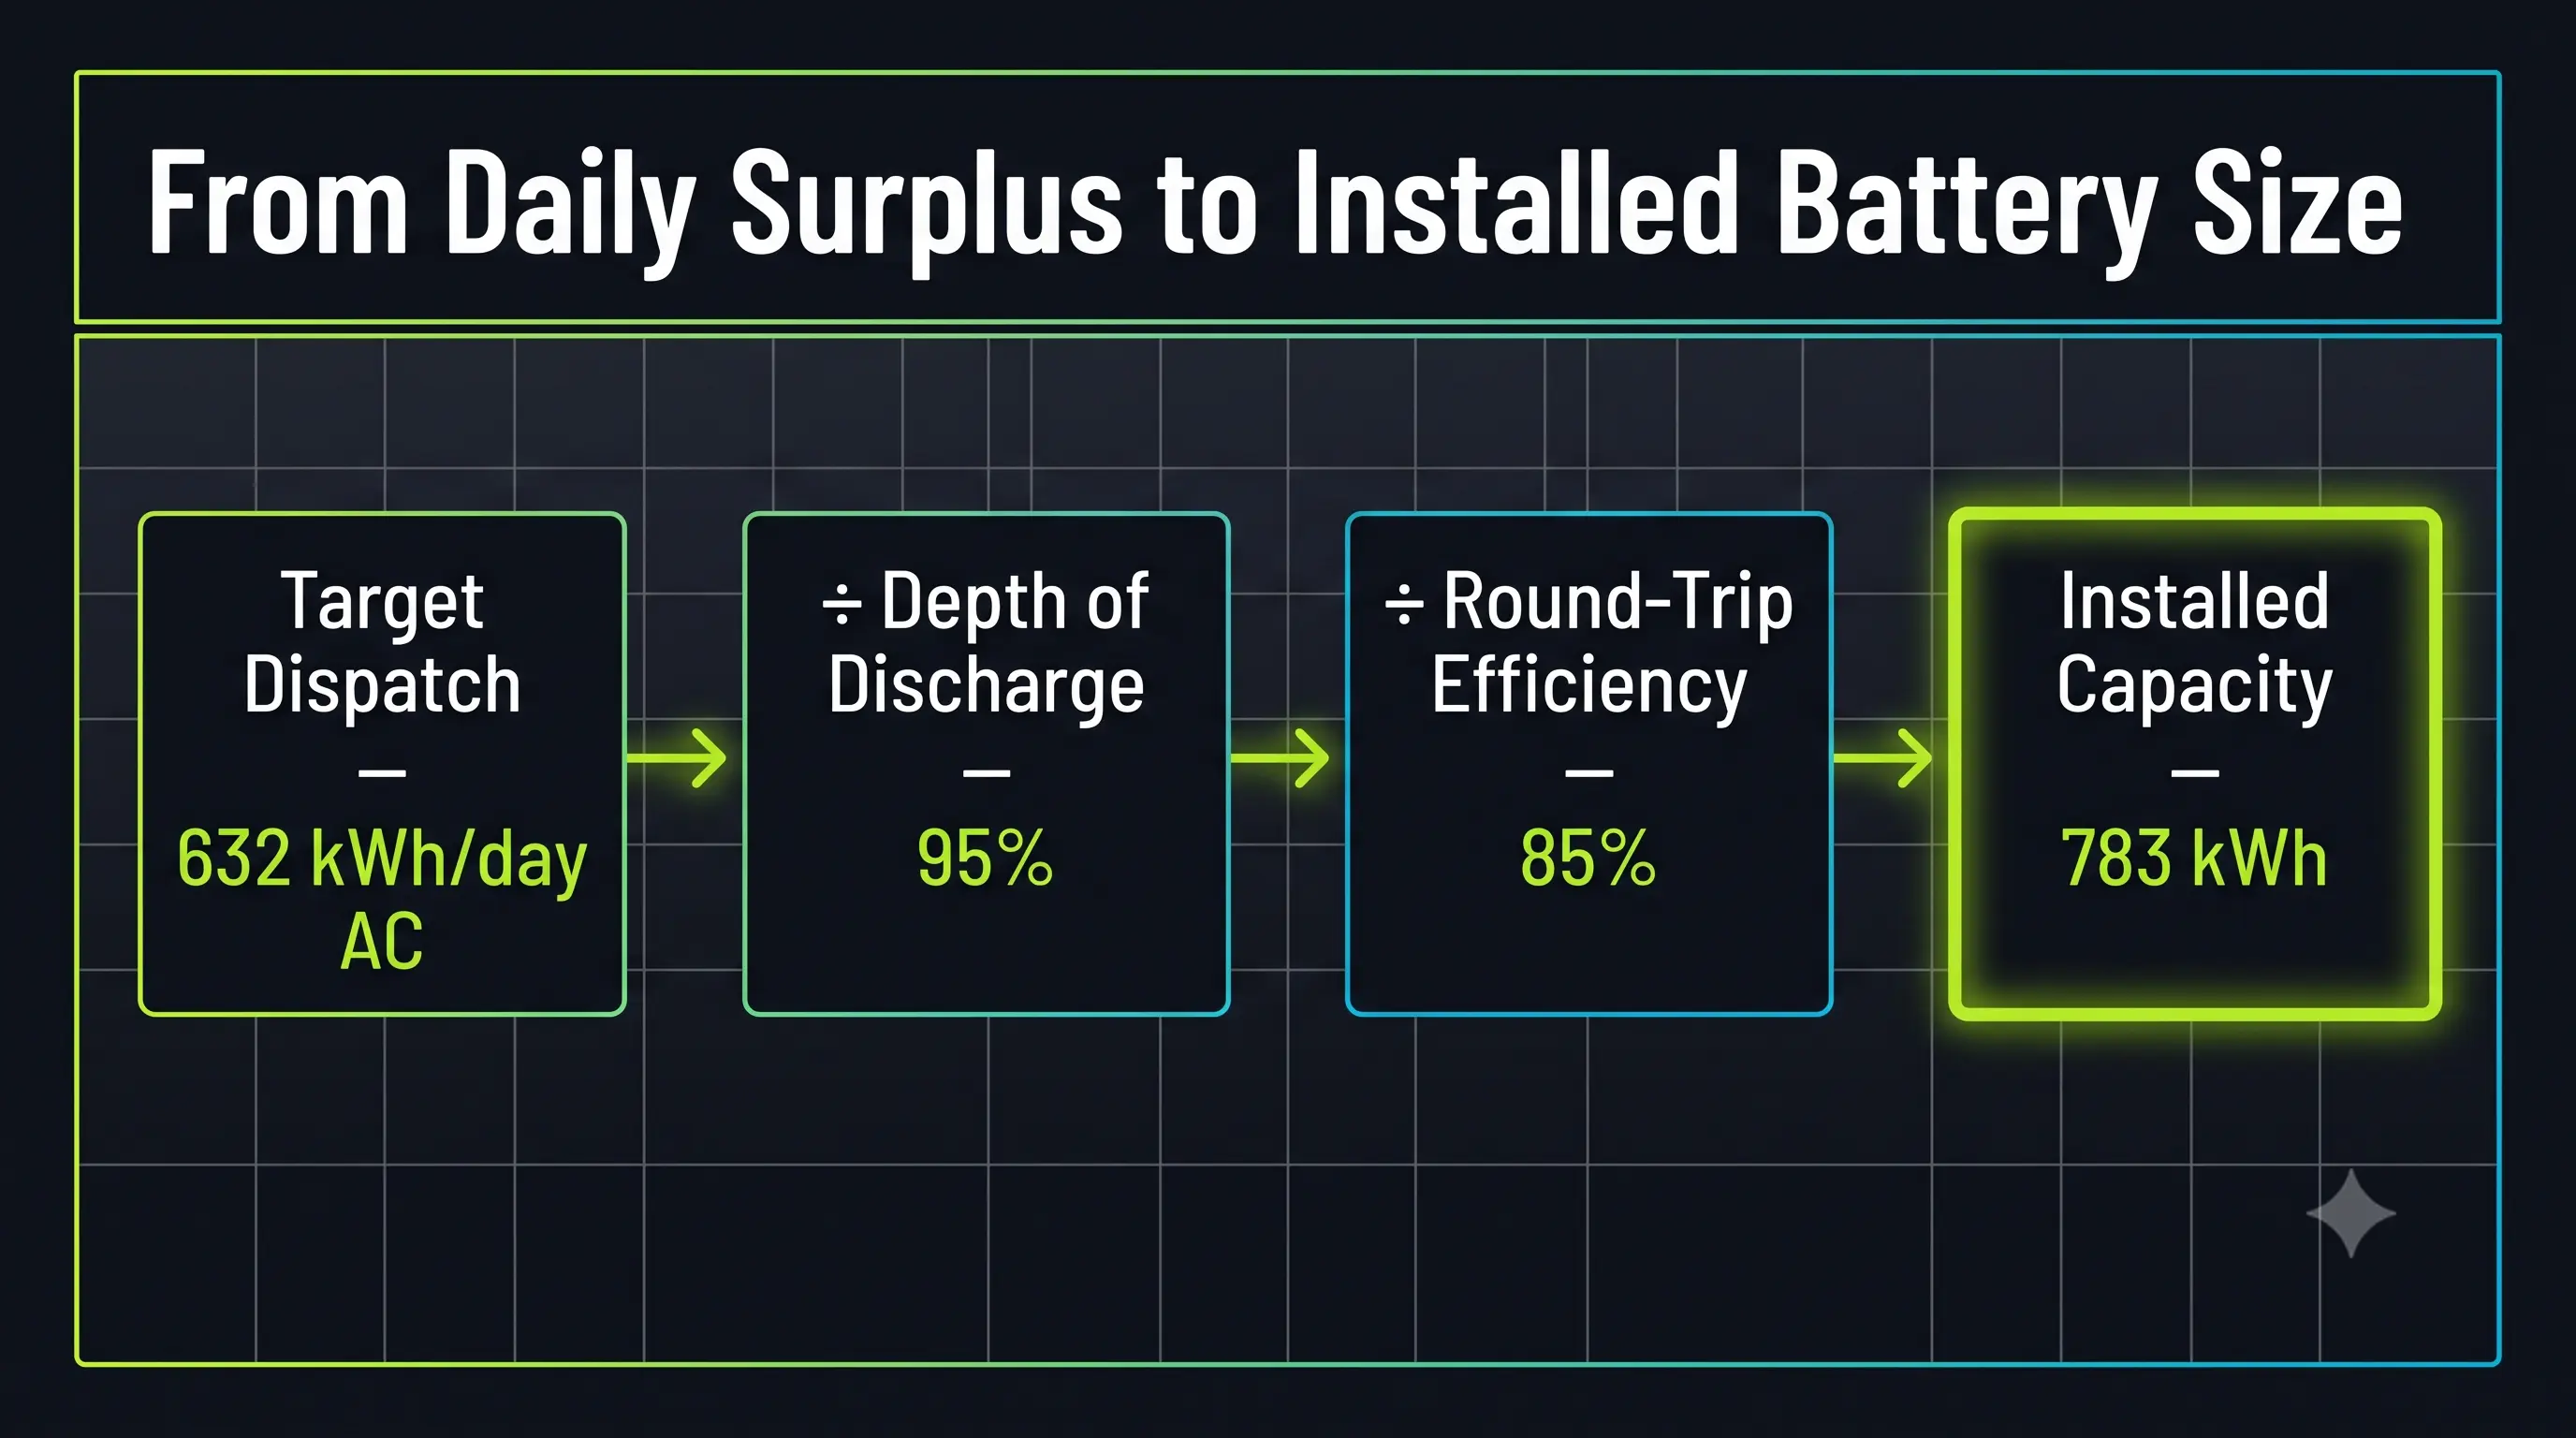
Sizing starts from the target — how much energy needs to reach the evening peak as usable AC output — and works backward through depth-of-discharge and round-trip efficiency losses to the installed DC capacity that delivers it.
| Parameter | Value | Basis |
|---|---|---|
| Target Dispatchable Energy | 632 kWh/day AC output | Matches daily surplus cap and financial model |
| Depth of Discharge (DoD) | 95% | LFP chemistry benchmark |
| AC-AC Round-Trip Efficiency (RTE) | 85% | OEM benchmark |
| Installed Battery Capacity | 783 kWh | 3 racks of 261 kWh each |
| Power Rating (charge/discharge) | 375 kW | 3 x 125 kW PCS modules with reserve margin |
Sizing formula: Installed kWh = Dispatchable ÷ (DoD × RTE) = 632 ÷ (0.95 × 0.85) = 783 kWh.
Technical Specification
| Parameter | Specification |
|---|---|
| Technology | Lithium Iron Phosphate (LFP) — inherently safe, thermally stable |
| Configuration | Grid-interactive, behind-the-meter (BTM) |
| Installed Energy Capacity | 783 kWh (DC nameplate) |
| Usable DC Capacity after DoD | 743 kWh |
| AC Output per Cycle | 632 kWh |
| Power Rating | 375 kW (3 x 125 kW PCS modules) |
| Daily Cycle Utilisation | 1 cycle/day (solar charge to evening discharge) |
| Charge Source | Rooftop solar surplus (primary); optional night grid top-up |
| Discharge Window | 18:00–22:00 IST (TNERC ToD evening peak slot) |
| Compliance | CEA safety standards; GISS BTM provisions; islanding protection mandatory |
| Connectivity | SCADA / BMS with remote monitoring |
| Enclosure | Outdoor IP55 containerised or indoor rack-mount |
Useful Life
| Parameter | Value |
|---|---|
| Manufacturer Design Life | 6,000 cycles (LFP industry standard) |
| Effective Cycle Rate | 1 cycle/day → 365 cycles/year |
| End-of-Life Threshold | Battery availability ≤ 70% of nameplate |
The Spread: What Storing Solar Is Actually Worth
Building the avoided-cost stack from Part 1's confirmed rates — not the headline evening-peak rate alone
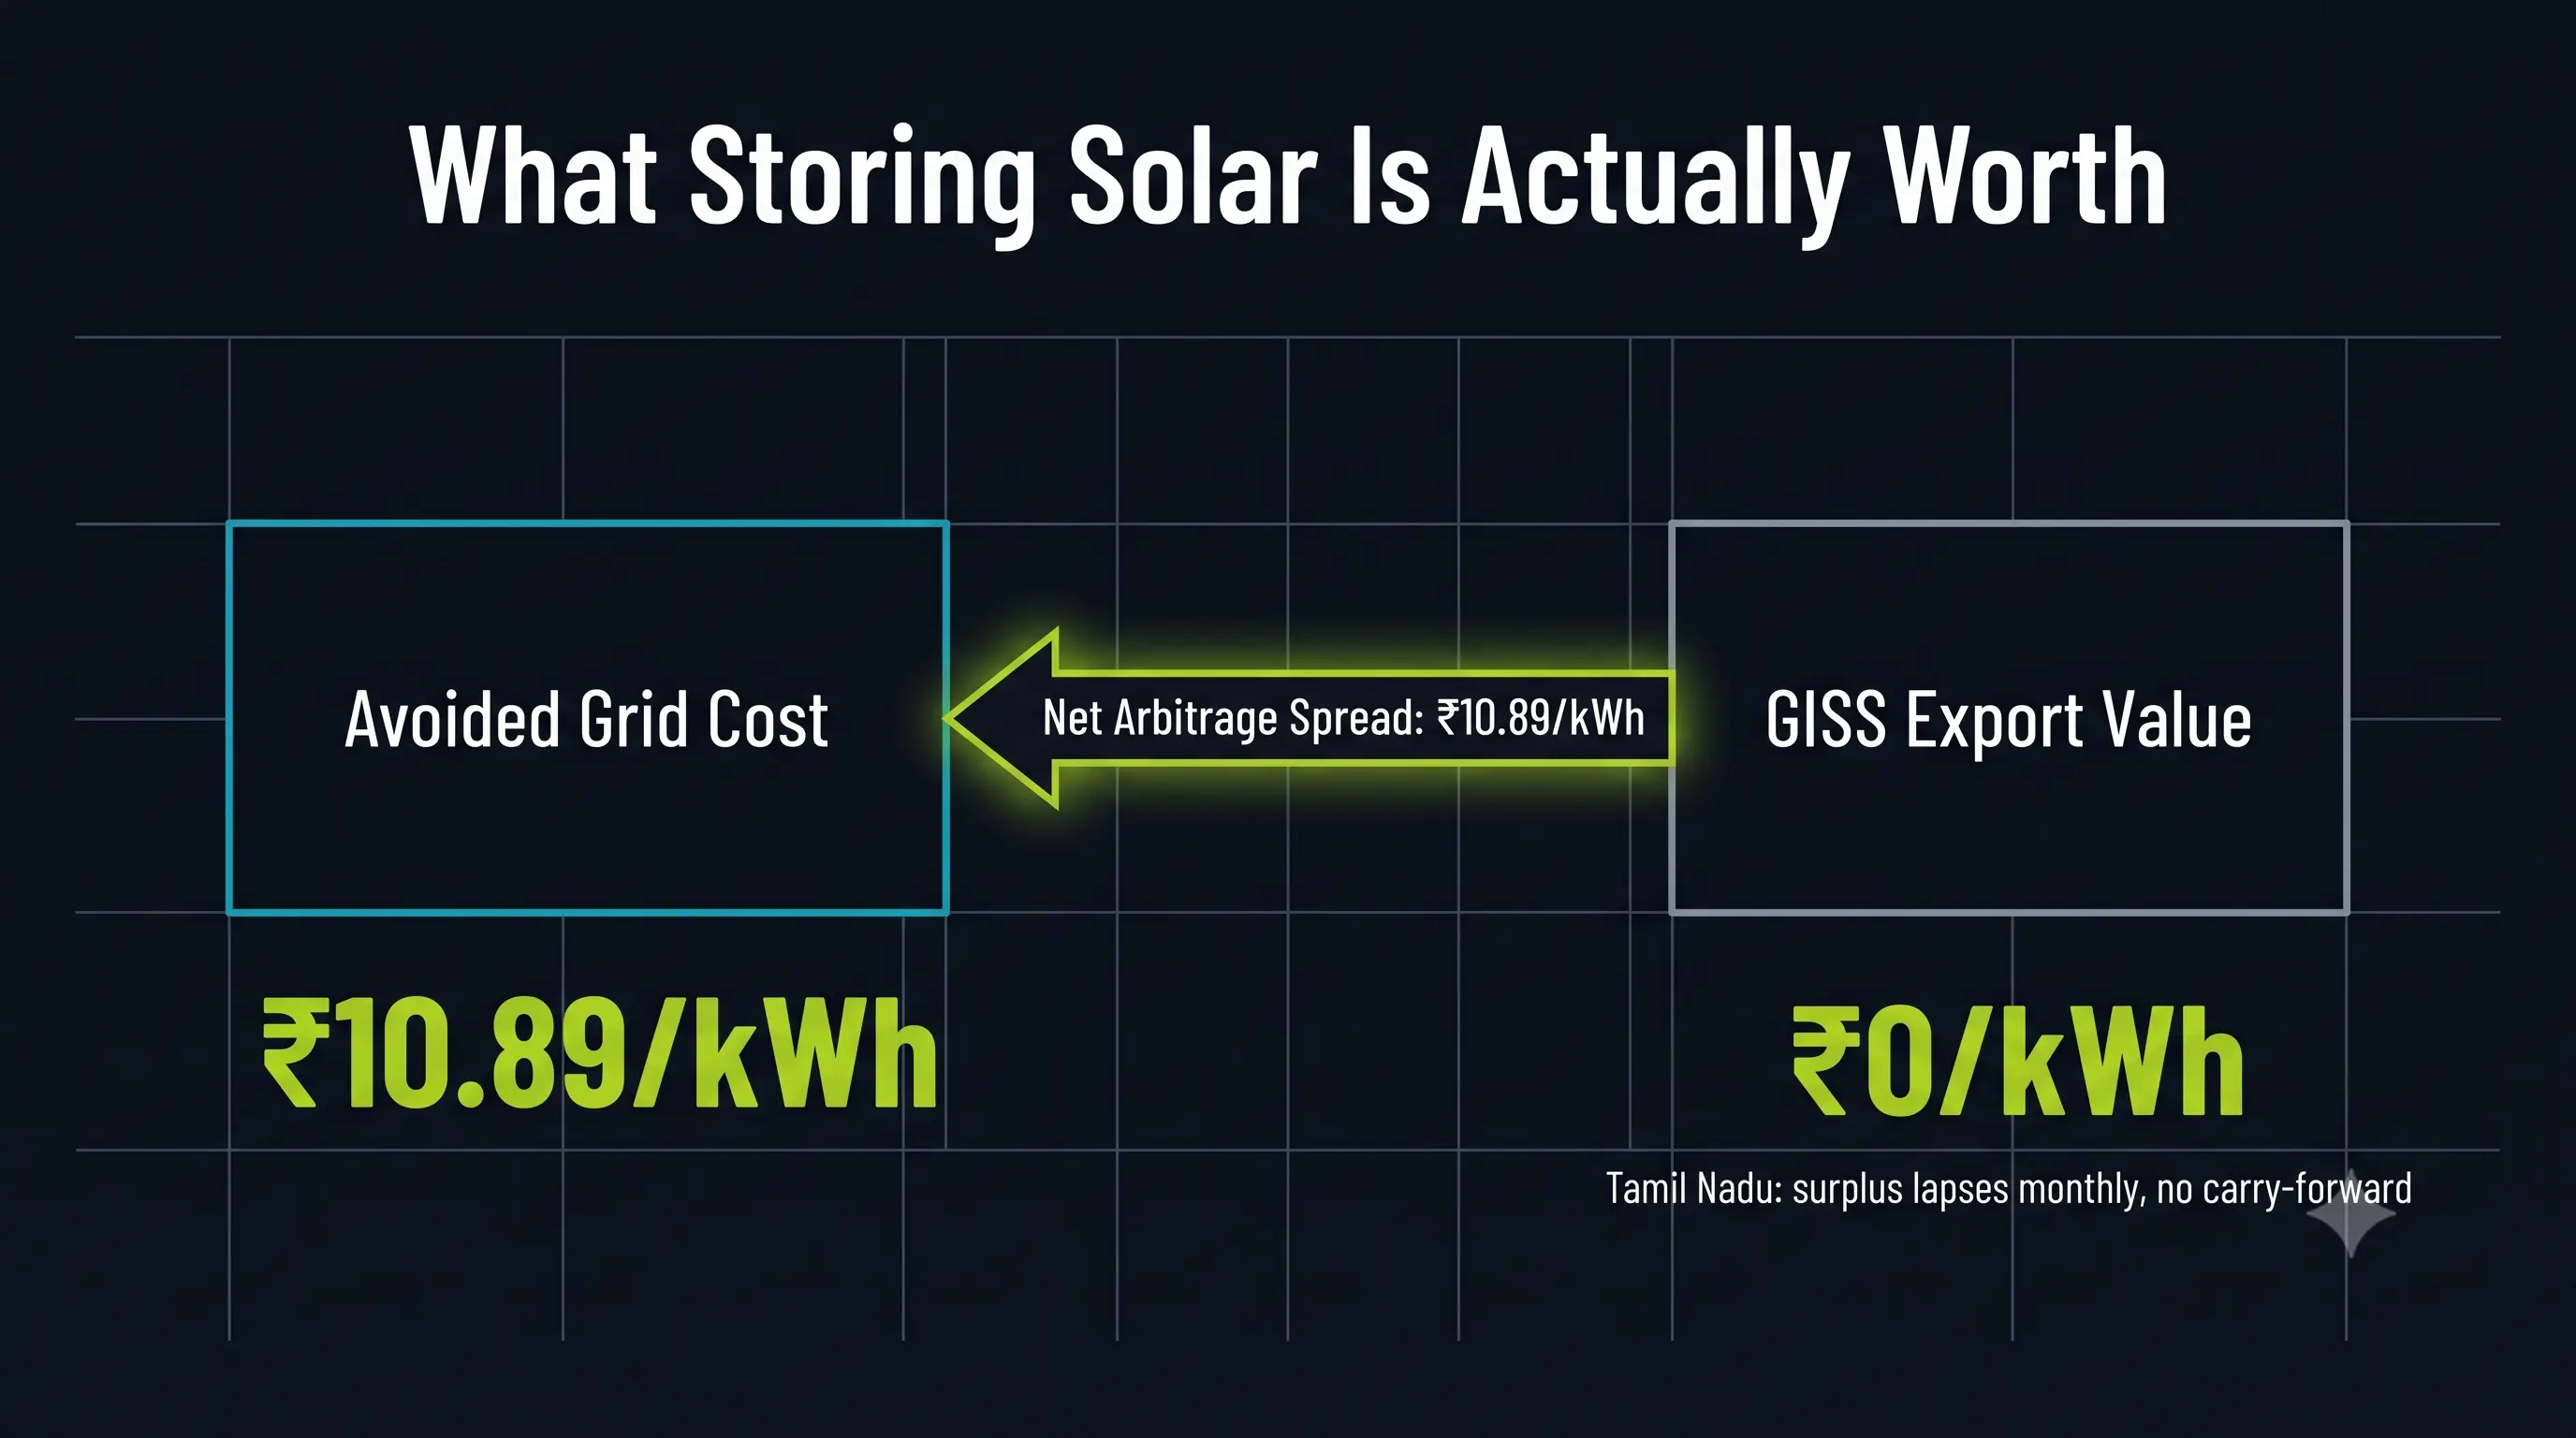
The value of shifting one kWh of rooftop solar from midday export to evening self-consumption is the gap between two numbers: what that unit is worth avoided at 6–10pm, and what it's worth exported instead. Both numbers need building up from confirmed rates, not read off a single tariff line.
Avoided Grid Cost — Evening Peak, Group Captive Structure
| Component | Rate | Basis |
|---|---|---|
| Energy Charge, incl. 25% ToD Peak surcharge | ₹9.38/kWh | HT-I base ₹7.50 + 25% peak surcharge, TNERC Order No.6 of 2025 |
| Wheeling / Network Charge | ₹1.04/kWh | Applies to all grid-imported units, TNERC Order No.6 of 2025 |
| Cross Subsidy Surcharge | ₹0.00/kWh | Waived — confirmed Group Captive open-access structure per Part 1's real bill |
| Electricity Tax, 5% ad valorem | ~₹0.47/kWh | 5% on taxable energy + peak charges (₹9.38 base) |
| Total Avoided Grid Cost | ₹10.89/kWh | Sum of Wheeling/Network Charge, Electricity Tax, and Energy Charges |
ℹ Source: TNERC Tariff Order No.6 of 2025; verified TNPDCL HT-I bill, Erode circle, May 2026.
Foregone Export Value — GISS Net Feed-In
The GISS feed-in tariff last set by TNERC (Generic Tariff Order No.8 of 2021, ₹3.10/kWh for the 151–999 kW band) expired 31 March 2023, with no successor rate located as of this article's publish date. More materially: TNERC's Green Energy Open Access Regulations, 2025 confirm that solar banking in Tamil Nadu is strictly monthly, with no carry-forward — unutilised surplus left over at month-end is bought back at only a fraction of the applicable RE tariff. For a facility that is already exporting more than it can bank or self-consume in several months of the year (see the February–March capacity-capped rows above), a meaningful share of that exported surplus is not being monetised at a stable per-unit rate at all — it is lapsing at month-end. This model treats the foregone export value conservatively as ₹0/kWh rather than applying an unconfirmed ₹3.10 rate to energy that Tamil Nadu's own banking rules don't guarantee gets paid for.
PWRNXT builds this same avoided-cost stack against your actual HT tariff category and metered surplus — not a template rate card.
Free analysis · No obligation
Reply within 4 business hours
Regulatory Posture: Mostly Carrot, One Structural Stick
Tamil Nadu's storage-relevant framework leans opportunity, not compliance:
- The 25% peak / −5% night ToD spread (TNERC Order No.6 of 2025) directly rewards load-shifting — a carrot that applies automatically to every ToD-metered HT consumer, no separate application required.
- BESS behind-the-meter is explicitly permitted under the GISS Regulations, 2021, subject to CEA safety standards and mandatory anti-islanding protection — no special storage-specific approval process beyond standard GISS registration.
- The Draft GISS Regulations, 2024 (under TNERC consultation as of this article's publish date) are expected to formally cover BESS-coupled solar and group/virtual net metering — a signal of regulatory direction, not yet a finalised rule.
- The one stick-like element: monthly-only banking with no carry-forward (Green Energy Open Access Regulations, 2025) doesn't penalise storage directly, but it removes the alternative — a facility can't simply bank its way around a mismatched generation/demand curve the way it could in a state with annual carry-forward. That structural fact is what pushes the economics toward storage rather than banking.
A note on precision: this article cites TNERC order and regulation numbers by name and number throughout, drawing on the same primary source Part 1 verified (TNERC Tariff Order No.6 of 2025) plus the GISS Regulations 2021/2024 as summarised in PWRNXT's internal facility assessment. Exact clause-level text for the BESS-specific GISS provisions was not independently re-verified against the regulation PDF for this article and should be confirmed before this framing is used in a client-facing regulatory opinion.
GST and Fiscal Treatment
| Item | GST Rate | Notes |
|---|---|---|
| Solar Power Generating System (composite EPC) | 5% | Covers goods + services under composite supply |
| BESS supplied as part of solar+BESS EPC | 5% | When structured as integral part of renewable energy generating system |
| BESS supplied standalone / retrofit | 18% | Standard battery rate — avoid this structure |
| Accelerated Depreciation | Eligible | Renewable energy assets qualify for higher depreciation under Income Tax Act |
| MNRE / State Subsidy | Not applicable | Capital subsidies are residential-only; C&I consumers ineligible |
Recommendation: structure the solar+BESS system as a single composite EPC contract to secure the 5% GST rate rather than the 18% standalone-battery rate.
The Economics: Capital Cost, Savings, and Payback
A 15-year model built on the corrected ₹10.89/kWh spread
Capital Cost
| Parameter | Value |
|---|---|
| Installed BESS Capacity | 783 kWh |
| All-in CapEx | ₹1.25 Cr (ex works, fully installed system; excludes civil works at site) |
| GST Treatment | 5% (composite solar+BESS EPC — see Section 03) |
| O&M | 3% of CapEx p.a., escalating at 5% p.a. |
Exclusions: civil works, foundation, trenching beyond agreed scope, statutory utility charges, and any owner-specific enabling works unless expressly included in the final EPC scope.
Year 1–15 Savings
Built on the corrected ₹10.89/kWh Year-1 spread (Section 03), the same battery-availability degradation curve as the technical model (Section 02), and 3% p.a. tariff escalation — conservative against Tamil Nadu's historical 4–5% trend.
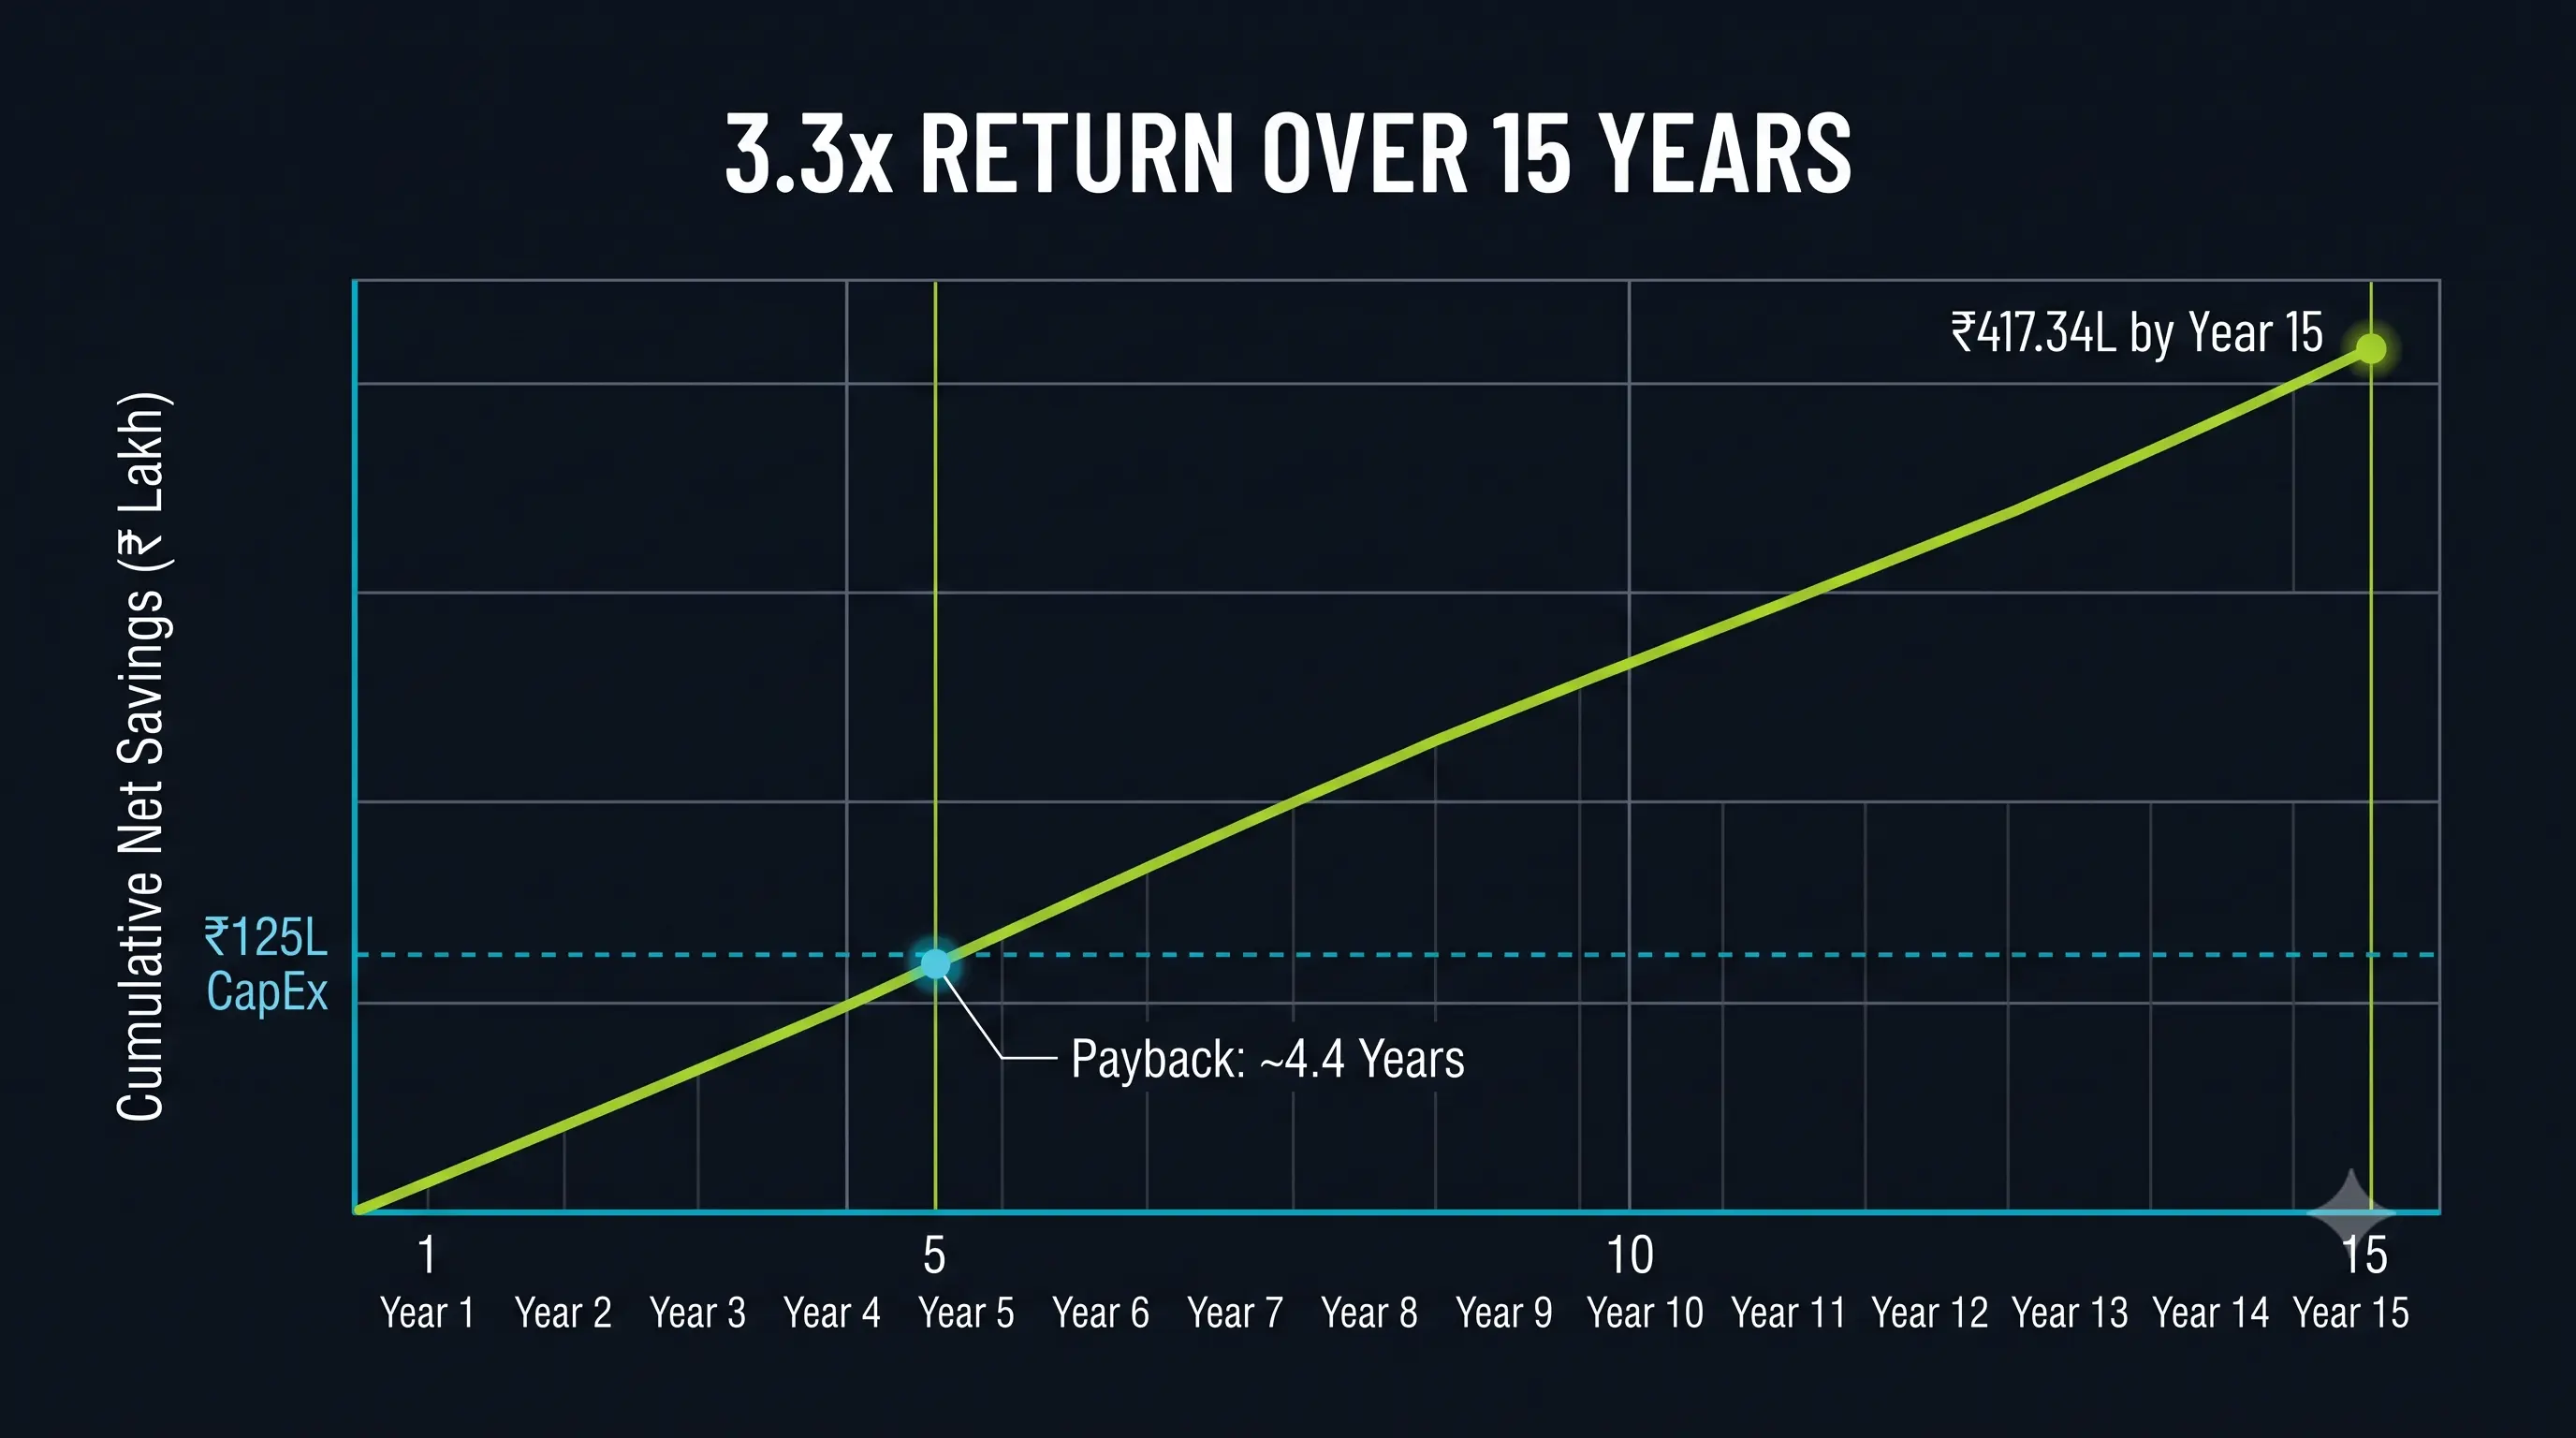
| Year | Gross Savings (₹L) | DG Replacement Savings (₹L) | O&M (₹L) | Net Savings (₹L) | Cumulative Net (₹L) |
|---|---|---|---|---|---|
| 1 | 20.99 | 11.03 | 3.75 | 28.27 | 28.27 |
| 2 | 21.20 | 11.03 | 3.94 | 28.29 | 56.56 |
| 3 | 21.41 | 11.03 | 4.13 | 28.31 | 84.87 |
| 4 | 21.61 | 11.03 | 4.34 | 28.30 | 113.17 |
| 5 | 21.80 | 11.03 | 4.56 | 28.27 | 141.44 |
| 6 | 21.98 | 11.03 | 4.79 | 28.22 | 169.66 |
| 7 | 22.14 | 11.03 | 5.03 | 28.14 | 197.80 |
| 8 | 22.29 | 11.03 | 5.28 | 28.04 | 225.84 |
| 9 | 22.44 | 11.03 | 5.54 | 27.93 | 253.77 |
| 10 | 22.57 | 11.03 | 5.82 | 27.78 | 281.55 |
| 11 | 22.69 | 11.03 | 6.11 | 27.61 | 309.16 |
| 12 | 22.80 | 11.03 | 6.41 | 27.42 | 336.58 |
| 13 | 22.88 | 11.03 | 6.73 | 27.18 | 363.76 |
| 14 | 22.97 | 11.03 | 7.07 | 26.93 | 390.69 |
| 15 | 23.04 | 11.03 | 7.42 | 26.65 | 417.34 |
ℹ Source: PWRNXT internal 15-year BESS financial model, built on TNERC Tariff Order No.6 of 2025 rates and the facility's metered surplus/diesel data.
Simple Payback: ~4.4 years (crossed within Year 5)
DG Replacement / Diesel Displacement
The client's own operating data shows annual diesel consumption of 11,760 litres at ₹93.77/litre — ₹11.03 lakh/year of diesel expense. At an assumed genset yield of 3.4 kWh/litre, that's approximately 39.98 MWh/year of diesel-derived energy the BESS can potentially displace through EMS-controlled coordination of PV, DG, and grid. This is modelled as a secondary value stream, additive to the solar-arbitrage case above, not a substitute for it.
Additional Value Streams (Qualitative)
- HT Demand Charge Reduction (Peak MDI Shaving): discharging during the 15-minute MDI integration window can reduce the recorded Maximum Demand Indicator. At the current ₹608/kVA/month demand charge, even a 50–100 kVA reduction generates meaningful additional savings on top of the ToD arbitrage modelled above. This stream can be quantified based upon 15-minute interval load data from the client's TNPDCL meter.
- Night-Rate Grid Top-Up During Monsoon: in months where daily solar surplus falls below the 632 kWh/day AC cap, unused BESS headroom can charge from the grid at the ₹7.13/kWh night rate and discharge into the ₹9.38/kWh peak window — an incremental spread of roughly ₹2.25/kWh, adding monsoon-month arbitrage value with no new infrastructure.
Investment Summary
The base case, at a glance
| Metric | Base Case |
|---|---|
| Installed BESS | 783 kWh / 375 kW |
| All-in CapEx (ex works) | ₹125 lakh |
| Annual Net Savings (Y1) | ₹28.27 lakh |
| 15-Year Net Savings | ₹417.34 lakh |
| Simple Payback | ~4.4 years |
| Payback with accelerated depreciation | ~3.7 years |
| Net Savings / CapEx Ratio | 3.34 |
| CO2 Avoided (indicative) | ~170 tCO2/year versus grid average emission factor |
Why Now
- TNERC's ToD framework is live and evening-peak pricing already applies to every HT-I consumer — the spread this model captures exists today, not on a future regulatory trigger.
- LFP BESS economics are commercially viable at C&I scale, evidenced by this facility's own sub-5-year payback.
- A composite solar+BESS EPC structure secures the 5% GST rate rather than the 18% standalone-battery rate — a fiscal lever that closes as soon as the two are procured separately.
- Acting under current GISS provisions establishes a pilot ahead of the Draft GISS Regulations, 2024 formalising BESS-coupled solar rules.
- A successful Erode deployment is directly replicable across other Tamil Nadu facilities on the same HT-I / GISS structure.
Frequently Asked Questions
The questions we hear most from Tamil Nadu C&I facilities evaluating this same sizing and spread model.
The Synthesis: How Much Storage, and What It's Worth
Part 1 asked what Tamil Nadu's tariff structure actually costs a facility that doesn't shift its load. This article answers the other half: for a real 700 kVA HT-I mill in Erode, closing that gap takes a 783 kWh / 375 kW battery, costs ₹125 lakh installed, and pays back in under 4.5 years on a spread that holds up even under a conservative, zero-value treatment of the facility's own solar exports.
The two structural facts driving that number aren't going away: Tamil Nadu's ToD surcharge applies automatically to every HT consumer today, and its monthly-only banking rule means unshifted solar surplus has nowhere to go but a discounted or lapsed export. Storage is the only lever that converts a facility's own generation curve into its own consumption curve — banking rules and export tariffs can't do that job in Tamil Nadu the way they might in a state with annual carry-forward.
This facility's 783 kWh / 375 kW sizing, spread, and payback came from its own real bill and its own metered surplus data — not a template. PWRNXT models the same for any Tamil Nadu HT facility as part of a free feasibility study, at zero capex.
Free · 5 working days · No capex commitment
In This Series
Part 1: Tamil Nadu C&I Tariff Decoded — TNERC HT I–V rates, ToD mechanics, and the Group Captive waiver this article builds on.
Get Your Own Facility's ₹10.89/kWh Number
PWRNXT engineers a free BESS feasibility study for your Tamil Nadu facility — sized to your load profile, tariff category, and solar capacity. Verified saving figure in 5 business days. Zero cost, zero obligation.